 Course 3
Simple, Appealing and Effective
Infographics are all that and more. They have also come a long way from 1626 when they are thought to have been invented but today’s technology has made them a very attractive way of putting a lot of information and data on one single sided piece of paper though sometimes we do need a rather large size of paper to have the text legible.
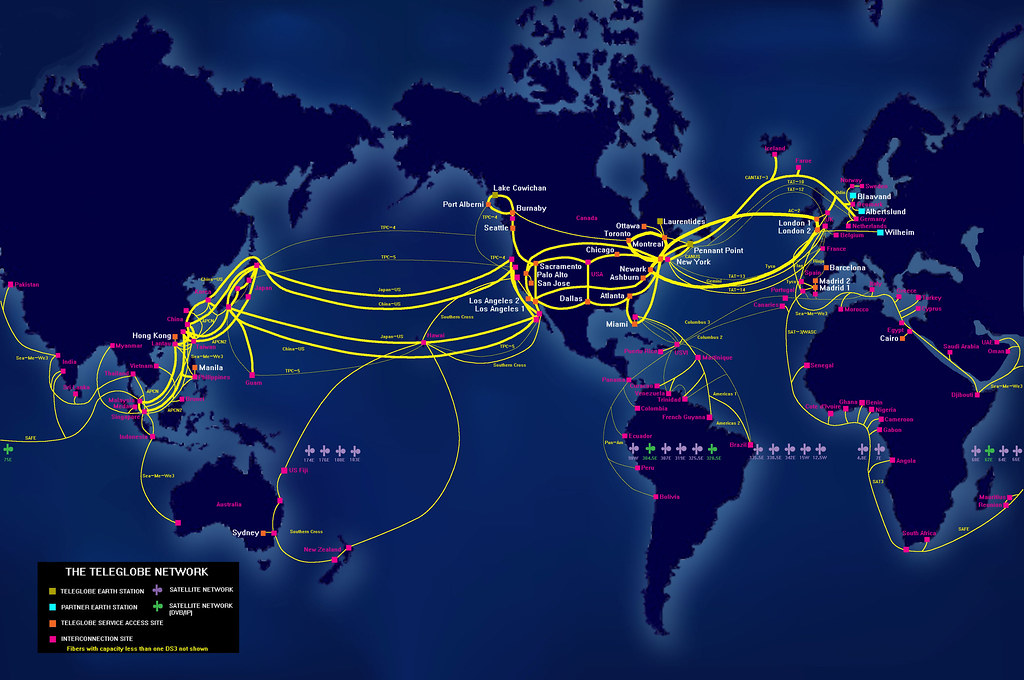
During the academic year I am called upon to explain Internet and its workings to students, specially in high school and I always find it useful to work with infographics as I have limited time and a lot of information to pass on. One of the infographic I would use is global Internet traffic maps similar to the one below:

I always find it interesting that very few of the students actually understand how the data flows through the Internet and this image puts the perspective right in front of them! From then onwards it is easier for me to go through the inner workings and principles of Internet traffic and the way our experiences are dependant on a vast number of factors.
True to the focus of this course I always have to add more information in terms of content which uses various other forms of visual literacy and I always find that this video from ‘Data Centers Canada’ explains it so well in about five minutes.
The resulting curiosity and questions as well as understanding automatically leads to a meaningful fulfilment of the purpose of my tiny contribution to learner’s journey of knowledge.
If you also have to explain the workings of Internet to your students you may want to use the wonderful app developed by Peer 1 Hosting and available to download for iOS and Android devices. It puts the 3D spin on visualising Internet in a mind boggling way. I love to show this to students.